Technical Note – Detection Limits – Cations – IONUS Ion Chromatograph
The membraPURE IONUS team wanted to produce a Technical Note on the capability of the IONUS for Cations. In the process, we validated the detection limits using a new cation 4mm x 250mm Cation column. The detection limits for mono and divalent cations are presented in Table 2 (ICH) and Table 3a and 3b (DIN) below. Detection limit data was calculated based on the datasets, the detection limits were calculated using two methods: ICH guidelines and DIN 32645.
a) Data was calculated according to the ICH guidelines, which are used for the Guideline on Validation of Analytical Procedures.
b) Data was calculated according to the DIN 32645 standard, which is applied in chemical analytics to determine the detection, identification, and quantification limits under repeatable conditions.
In discussions with clients, we noticed that references were made exclusively to LOD or LOQ in terms of pmol, without any connection to the concentration or the parameters of the experimental setup. When it came to the concentration values determined using the DIN 32645 method, which we have preferred in the past and which is well-known in the German and European regions, but relatively unknown internationally, we mostly encountered limited understanding.
In contrast, the ICH method appears to have a broader level of recognition, as discussed with other business partners
As a result, we decided to calculate the values using two methods, allowing the customer to choose which data they prefer to follow. In the DIN method, we have opted for two different determination methods in order to fully reflect the investigations. Below is a clear comparison in Table 1 of the two methods.
On request, we can provide the raw data, enabling customers to perform their own calculations.
Operating Conditions of the Method:
| IC System | IONUS Ion Chromatograph |
| Column | Repromer CAT, 7 mm, 4 mm x 250 mm |
| Eluent | 4.0 mM Salpetersäure |
| Eluent Flow Rate: | 0.7 mL/min |
| Column Temp: | 40°C |
| Injection | 20 µL |
| Water Source | Aquinity² P10 Analytical (0.055 µS/cm, Type I) |
Sample Preparation
We used standards of 1000 ppm (Inorganic Ventures), certified by the supplier and based on sodium.
Using the prepared individual 1000 mg/Kg standards, a mixed stock working standard was prepared. The stock standard was used to produce various concentration ranges by weight to develop the calibration curve for the project. The exact mass values recorded in the laboratory worksheets can be provided upon request.
Table 1: Comparison between calculations of LOD according to ICH & DIN 32645
| Scope | ICH Q2(R1) | DIN 32645 |
| Objective | Validation of analytical methods in the pharmaceutical sector. | Definition and determination of detection, quantification, and determination limits in chemical analysis. |
| Definition of LOD | Smallest amount of an analyte that can be detected with acceptable certainty. | Smallest concentration of an analyte distinguishable from the blank value with a predefined statistical confidence. |
| Calculation Method | LOD = 3.3 × (σ/S), where σ is the standard deviation of the signal, and S is the slope of the calibration curve. | Uses the standard deviation of the blank value or the residuals from the calibration curve to calculate the detection limit. |
| Required Data | Multiple measurements of low-concentration samples to determine σ; calibration curve to determine S. | Measurements of blank samples and/or calibration standards; statistical evaluation to determine standard deviations and calibration function. |
| Scope of Application | Pharmaceutical analysis, particularly for validating quality control methods for drugs. | General chemical analysis, including environmental analysis and other fields requiring detection and quantification limits. |
| Statistical Basis | Based on the standard deviation of the signal and slope of the calibration curve; considers method precision. | Detailed statistical methods to determine detection, quantification, and determination limits; accounts for both systematic and random errors. |
| Practical Implementation | Requires creating a calibration curve in the low-concentration range and performing multiple measurements to calculate the standard deviation. | Involves detailed statistical tests, including variance homogeneity, linearity checks, and outlier detection. |
| Advantages | Relatively simple calculation; widely used in the pharmaceutical industry; tailored to drug analysis requirements. | Comprehensive and detailed methodology; applicable to a wide range of analytical procedures; provides clear definitions and statistical reliability. |
| Disadvantages | May lack detailed statistical assurance; designed specifically for pharmaceutical applications and may not directly apply to other fields. | More complex statistical requirements; requires extensive data collection and analysis; potentially more labor-intensive to implement. |
To remove any particulate matter, the prepared solutions were filtered through a 0.22 µm pore size ion chromatography (IC) filter. The filtered solutions were then transferred to 1.5 mL vials sealed with septa caps for storage and subsequent analysis.
To ensure data reliability and minimize experimental error, 10-15 replicate injections were performed for each sample solution. Additionally, 10-20 injections of blank samples containing only UPW were conducted. These blank injections serve to establish a stable baseline signal and to identify any potential contamination within the analytical system. The acquired chromatographic data was processed and analyzed using the Clarity software (DataApex). The final results were then evaluated and compared to the established analytical standards or relevant regulatory norms
Calculations:
Below is a summary in bullet points of the data evaluations and the determination of detection limits:
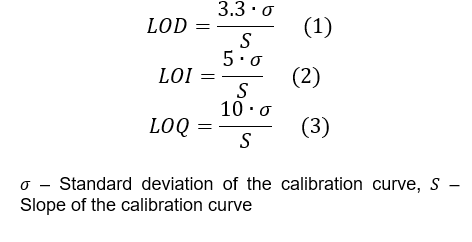
ICH method [1]:
- Determine the average signal (peak area) for each concentration level
- Compute a linear regression of the signal as a function of concentration
- Determine the standard deviation of the calibration curve.
- Apply formulas (1), (2) and (3) to calculate the LOD, LOI and LOQ, respectively.
DIN 32645 Blank method [2]:
- Determine the average signal (peak area) for each concentration level
- Compute a linear regression of the signal as a function of concentration
- Calculate the mean signal (Noise) and the standard deviation of the blank samples.
- Identify the t-student accounting for a system with x degrees of freedom (y number of blank measurements) and an intended confidence interval of 95%.
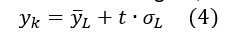
- Calculate the critical signal, equation (4)
- Apply formulas (5), (6) and (7) to calculate the LOD, LOI and LOQ, respectively.
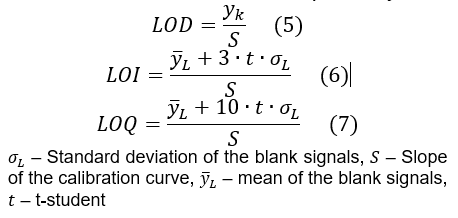
DIN 32645 Calibration Curve method [2]:
- Determine the average signal (peak area) for each concentration level
- Compute a linear regression of the signal as a function of concentration
- Determine the standard deviation of the calibration curve.
- Identify the t-student value. For a system with 9 degrees of freedom (11 concentration levels) and an intended confidence interval of 95%, t-student is 1.833113.
- Apply formulas (8), (9) and (10) to calculate the LOD, LOI and LOQ, respectively.
Results
Table 2: Approximate Single Laboratory Cation Detection Limits in Reagent Water, according to the ICH Method
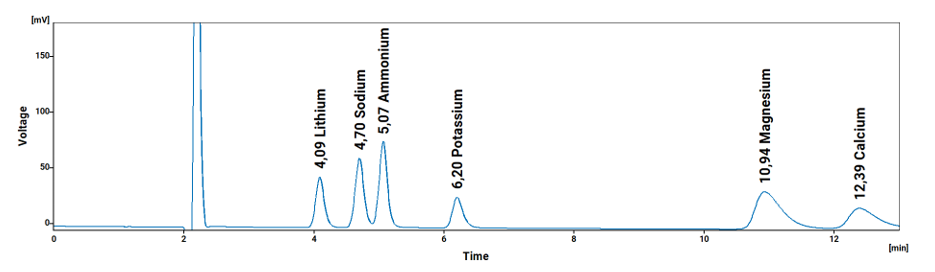
| Analyte / Peak # | Symbol | Retention Time / min | LOD / ppm | LOI /ppm | LOQ / ppm |
| Lithium / 1 | Li | 4.07 | 0.019 | 0.028 | 0.056 |
| Sodium / 2 | Na | 4.66 | 0.078 | 0.118 | 0.235 |
| Ammonium / 3 | NH3 | 5.02 | 0.092 | 0.139 | 0.278 |
| Potassium / 4 | K | 6.18 | 0.264 | 0.399 | 0.799 |
| Magnesium / 5 | Mg | 10.93 | 0.075 | 0.114 | 0.228 |
| Calcium / 6 | Ca | 12.35 | 0.184 | 0.279 | 0.559 |
Table 3a: Approximate Single Laboratory Cation Detection Limits in Reagent Water, according to DIN 32645 Blank Method
| Analyte / Peak # | Symbol | Retention Time / min | LOD / ppm | LOI /ppm | LOQ / ppm |
| Lithium / 1 | Li | 4.07 | 0.005 | 0.010 | 0.028 |
| Sodium / 2 | Na | 4.66 | 0.017 | 0.035 | 0.099 |
| Ammonium / 3 | NH3 | 5.02 | 0.014 | 0.030 | 0.084 |
| Potassium / 4 | K | 6.18 | 0.032 | 0.067 | 0.190 |
| Magnesium / 5 | Mg | 10.93 | 0.010 | 0.022 | 0.062 |
| Calcium / 6 | Ca | 12.35 | 0.019 | 0.039 | 0.111 |
Table 3b: Approximate Single Laboratory Cation Detection Limits in Reagent Water, according to DIN 32645 Calibration Curve Method
| Analyte / Peak # | Symbol | Retention Time / min | LOD / ppm | LOI /ppm | LOQ / ppm |
| Lithium / 1 | Li | 4.07 | 0.010 | 0.031 | 0.103 |
| Sodium / 2 | Na | 4.66 | 0.043 | 0.129 | 0.431 |
| Ammonium / 3 | NH3 | 5.02 | 0.051 | 0.153 | 0.509 |
| Potassium / 4 | K | 6.18 | 0.146 | 0.439 | 1.465 |
| Magnesium / 5 | Mg | 10.93 | 0.042 | 0.125 | 0.417 |
| Calcium / 6 | Ca | 12.35 | 0.102 | 0.307 | 1.024 |
Conclusions
After comparing chromatography columns from various manufacturers, the Repromer CAT column was identified as the most suitable in terms of price-performance ratio. Considering that only the lower injection volume was selected, and that injection volumes of 50 or 100 µL are also possible, the system demonstrates capability for meeting unusual requirements, especially when operating at the lower ppb level.
Literature
[1] International Council for Harmonisation of Technical Requirements for Pharmaceutical for Human Use (ICH), ICH Q2(R2) Guideline: Validation of Analytical Procedures, 2023. Available at:
[2] DIN Deutsches Institut für Normung e.V., DIN 32645: Chemische Analytik – Nachweis-, Erfassungs- und Bestimmungsgrenze unter Wiederholbedingungen – Begriffe, Verfahren, Auswertung, 2008.
Available at: https://www.beuth.de/