Technischer Hinweis – Nachweisgrenzen – Anionen – IONUS Ionenchromatograph
Das folgende Datenblatt enthält die Nachweisgrenzen für Anionen. Ausgehend von den Datensätzen wurden die Nachweisgrenzen nach zwei Methoden berechnet:
a) nach der Norm DIN 32645, die in der chemischen Analytik zur Bestimmung der Nachweis-, Identifizierungs- und Quantifizierungsgrenzen unter wiederholbaren Bedingungen angewendet wird und
b) nach den ICH-Richtlinien, die für die Guideline on Validation of Analytical Procedures verwendet werden.
In Gesprächen mit Kunden stellten wir fest, dass ausschließlich auf LOD oder LOQ in pmol Bezug genommen wurde, ohne dass ein Zusammenhang mit der Konzentration oder den Parametern des Versuchsaufbaus hergestellt wurde. Bei den Konzentrationswerten, die nach der von uns in der Vergangenheit bevorzugten, im deutschen und europäischen Raum bekannten, international aber relativ unbekannten Methode DIN 32645 ermittelt wurden, stießen wir meist auf wenig Verständnis.
Die ICH-Methode scheint dagegen einen breiteren Bekanntheitsgrad zu haben, wie wir mit anderen Geschäftspartnern diskutiert haben.
Daher haben wir uns entschlossen, die Werte nach zwei Methoden zu berechnen, wobei der Kunde wählen kann, welche Daten er bevorzugt. Bei der DIN-Methode haben wir uns für zwei unterschiedliche Ermittlungsmethoden entschieden, um die Untersuchungen vollständig abzubilden. Nachfolgend finden Sie in Tabelle 1 einen klaren Vergleich der beiden Methoden.
Wir sind auch in der Lage, die Rohdaten zur Verfügung zu stellen, damit die Kunden ihre eigenen Berechnungen durchführen können.
Einsatzbedingungen der Methode:
| IC System | IONUS Ion Chromatograph |
| Column | ICSep AN300B, 4.6 mm x 250 mm |
| Eluent | 3.0 mM Sodium Carbonate / 0.05 mM Sodium Thiocyanate |
| Suppressor | membraPure IC Suppressor² PEEK, 4.6 mm x 50 mm |
| Regenerant | 1N Sulfuric Acid |
| Eluent Flow Rate: | 1.0 mL/min |
| Column Temp: | 35°C |
| Injection | 20 µL |
| Water Source | Aquinity² P10 Analytical (0.055 µS/cm, Type I) |
Vorbereitung der Proben
Zur Herstellung der Analyselösungen wurden genaue Mengen der Zielanionen eingewogen, um einen individuellen 1000 mg/Kg-Standard zu erhalten, wenn dieser in Reinstwasser gelöst wurde. Diese bekannten Massen wurden dann in Reinstwasser (UPW) aufgelöst, um individuelle Lösungen mit 1000 mg/Kg-Konzentrationen herzustellen.
Wir verwendeten 1000 ppm-Standards (Inorganic Ventures), die zumeist zertifiziert sind und auf Natrium basieren.
Mit den vorbereiteten individuellen 1000 mg/Kg-Standards wurde ein gemischter Arbeitsstandard auf Vorrat hergestellt. Mit dem Stammstandard wurden verschiedene Konzentrationsbereiche nach Gewicht erstellt, um die Kalibrierkurve für das Projekt zu entwickeln. Die genauen Massenwerte, die in den Arbeitsblättern des Labors aufgezeichnet wurden, können auf Anfrage zur Verfügung gestellt werden.
Tabelle 1: Vergleich zwischen der Berechnung der LOD nach ICH und DIN 32645
| Scope | ICH Q2(R1) | DIN 32645 |
| Objective | Validation of analytical methods in the pharmaceutical sector. | Definition and determination of detection, quantification, and determination limits in chemical analysis. |
| Definition of LOD | Smallest amount of an analyte that can be detected with acceptable certainty. | Smallest concentration of an analyte distinguishable from the blank value with a predefined statistical confidence. |
| Calculation Method | LOD = 3.3 × (σ/S), where σ is the standard deviation of the signal, and S is the slope of the calibration curve. | Uses the standard deviation of the blank value or the residuals from the calibration curve to calculate the detection limit. |
| Required Data | Multiple measurements of low-concentration samples to determine σ; calibration curve to determine S. | Measurements of blank samples and/or calibration standards; statistical evaluation to determine standard deviations and calibration function. |
| Scope of Application | Pharmaceutical analysis, particularly for validating quality control methods for drugs. | General chemical analysis, including environmental analysis and other fields requiring detection and quantification limits. |
| Statistical Basis | Based on the standard deviation of the signal and slope of the calibration curve; considers method precision. | Detailed statistical methods to determine detection, quantification, and determination limits; accounts for both systematic and random errors. |
| Practical Implementation | Requires creating a calibration curve in the low-concentration range and performing multiple measurements to calculate the standard deviation. | Involves detailed statistical tests, including variance homogeneity, linearity checks, and outlier detection. |
| Advantages | Relatively simple calculation; widely used in the pharmaceutical industry; tailored to drug analysis requirements. | Comprehensive and detailed methodology; applicable to a wide range of analytical procedures; provides clear definitions and statistical reliability. |
| Disadvantages | May lack detailed statistical assurance; designed specifically for pharmaceutical applications and may not directly apply to other fields. | More complex statistical requirements; requires extensive data collection and analysis; potentially more labor-intensive to implement. |
Um alle Partikel zu entfernen, wurden die vorbereiteten Lösungen durch einen Ionenchromatographie-Filter (IC-Filter) mit einer Porengröße von 0,22 µm filtriert. Die gefilterten Lösungen wurden dann zur Lagerung und anschließenden Analyse in 1,5-mL-Fläschchen umgefüllt, die mit Septakappen verschlossen waren.
Um die Zuverlässigkeit der Daten zu gewährleisten und experimentelle Fehler zu minimieren, wurden für jede Probenlösung 10-15 Wiederholungsinjektionen durchgeführt. Zusätzlich wurden 10-20 Injektionen von Leerproben, die nur UPW enthielten, durchgeführt. Diese Leerwertinjektionen dienen dazu, ein stabiles Basissignal zu ermitteln und mögliche Verunreinigungen innerhalb des Analysesystems zu identifizieren. Die erfassten chromatographischen Daten wurden mit der Clarity-Software (DataApex) verarbeitet und analysiert. Die Endergebnisse wurden dann ausgewertet und mit den etablierten Analysestandards oder den einschlägigen gesetzlichen Normen verglichen.
Berechnungen:
Nachfolgend finden Sie eine Zusammenfassung der Datenauswertungen und der Bestimmung der Nachweisgrenzen in Form von Aufzählungspunkten:
ICH-Methode [1]:
- Bestimmen Sie das durchschnittliche Signal (Peakfläche) für jede Konzentrationsstufe
- Berechnen Sie eine lineare Regression des Signals als Funktion der Konzentration
- Bestimmen Sie die Standardabweichung der Kalibrierkurve.
- Wenden Sie die Formeln (1), (2) und (3) an, um die LOD, LOI bzw. LOQ zu berechnen.

DIN 32645 Blank Methode [2]:
- Bestimmen Sie das durchschnittliche Signal (Peakfläche) für jede Konzentrationsstufe
- Berechnen Sie eine lineare Regression des Signals als Funktion der Konzentration
- Berechnen des mittleren Signals (Rauschens) und der Standardabweichung der Blindproben.
- Bestimmen Sie die t-Student-Rechnung für ein System mit x Freiheitsgraden (y Anzahl der Leerwertmessungen) und einem angestrebten Konfidenzintervall von 95%.
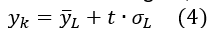
- Berechnen Sie das kritische Signal, Gleichung (4)
- Wenden Sie die Formeln (5), (6) und (7) an, um die LOD, LOI bzw. LOQ zu berechnen.

DIN 32645 Kalibrationskurven-Methode [2]:
- Bestimmen Sie das durchschnittliche Signal (Peakfläche) für jede Konzentrationsstufe
- Berechnen Sie eine lineare Regression des Signals als Funktion der Konzentration
- Bestimmen Sie die Standardabweichung der Kalibrierkurve.
- Bestimmen Sie den t-Student-Wert. Für ein System mit 9 Freiheitsgraden (11 Konzentrationsstufen) und einem angestrebten Konfidenzintervall von 95% beträgt der t-student-Wert 1,833113.
- Wenden Sie die Formeln (8), (9) und (10) an, um die LOD, LOI bzw. LOQ zu berechnen.

Ergebnisse
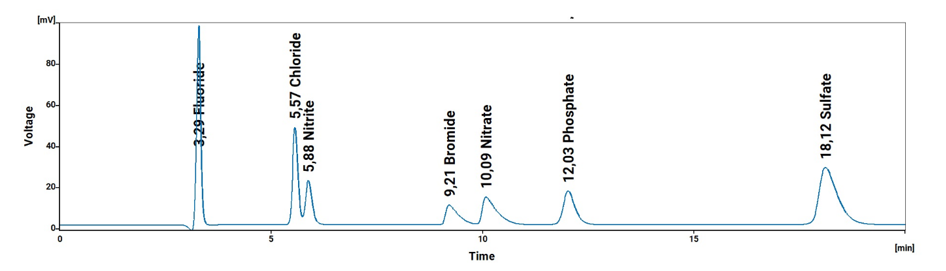
Tabelle 1: Ungefähre Nachweisgrenzen für Anionen in Reagenzwasser für ein einzelnes Labor gemäß der ICH-Methode
| Analyte / Peak # | Symbol | Retention Time / min | LOD / ppm | LOI /ppm | LOQ / ppm |
| Fluoride / 1 | F | 3.28 | 0.388 | 0.588 | 1.177 |
| Chloride / 2 | Cl | 5.61 | 0.222 | 0.336 | 0.672 |
| Nitrite / 3 | NO2 | 5.93 | 0.150 | 0.228 | 0.456 |
| Bromide / 4 | Br | 9.57 | 0.144 | 0.218 | 0.435 |
| Nitrate / 5 | NO3 | 10.48 | 2.832 | 4.290 | 8.581 |
| Phosphate / 6 | PO4 | 12.19 | 0.645 | 0.977 | 1.954 |
| Sulfate / 7 | SO4 | 18.41 | 0.643 | 0.974 | 1.947 |
Tabelle 2: Ungefähre Nachweisgrenzen für Anionen in Reagenzwasser nach DIN 32645 Leerwertmethode
| Analyte / Peak # | Symbol | Retention Time / min | LOD / ppm | LOI /ppm | LOQ / ppm |
| Fluoride / 1 | F | 3.28 | 0.013 | 0.034 | 0.108 |
| Chloride / 2 | Cl | 5.61 | 0.022 | 0.057 | 0.180 |
| Nitrite / 3 | NO2 | 5.93 | 0.036 | 0.093 | 0.293 |
| Bromide / 4 | Br | 9.57 | 0.086 | 0.225 | 0.710 |
| Nitrate / 5 | NO3 | 10.48 | 0.040 | 0.104 | 0.328 |
| Phosphate / 6 | PO4 | 12.19 | 0.081 | 0.211 | 0.666 |
| Sulfate / 7 | SO4 | 18.41 | 0.031 | 0.081 | 0.257 |
Tabelle 3: Ungefähre Nachweisgrenzen für Anionen in Reagenzwasser für ein einzelnes Labor gemäß DIN 32645 Kalibrierkurvenmethode
| Analyte / Peak # | Symbol | Retention Time / min | LOD / ppm | LOI /ppm | LOQ / ppm |
| Fluoride / 1 | F | 3.28 | 0.219 | 0.656 | 2.188 |
| Chloride / 2 | Cl | 5.61 | 0.125 | 0.375 | 1.249 |
| Nitrite / 3 | NO2 | 5.93 | 0.085 | 0.254 | 0.848 |
| Bromide / 4 | Br | 9.57 | 0.081 | 0.243 | 0.809 |
| Nitrate / 5 | NO3 | 10.48 | 1.596 | 4.787 | 15.956 |
| Phosphate / 6 | PO4 | 12.19 | 0.363 | 1.090 | 3.634 |
| Sulfate / 7 | SO4 | 18.41 | 0.362 | 1.086 | 3.621 |
Schlussfolgerungen
Nach dem Vergleich von Chromatographiesäulen verschiedener Hersteller wurde die AN300B-Säule als die am besten geeignete Säule in Bezug auf das Preis-Leistungs-Verhältnis identifiziert. Wenn man bedenkt, dass nur das untere Injektionsvolumen gewählt wurde und auch Injektionsvolumina von 50 oder 100 µL möglich sind, zeigt das System, dass es in der Lage ist, auch ungewöhnliche Anforderungen zu erfüllen, insbesondere wenn es im unteren ppb-Bereich arbeitet.
Hinweis: Die zum Artikel gehörige PDF ist zum Download nur auf Englisch verfügbar.
Literatur
[1] International Council for Harmonisation of Technical Requirements for Pharmaceutical for Human Use (ICH), ICH Q2(R2) Guideline: Validation of Analytical Procedures, 2023. Verfügbar unter:
[2] DIN Deutsches Institut für Normung e.V., DIN 32645: Chemische Analytik – Nachweis-, Erfassungs- und Bestimmungsgrenze unter Wiederholbedingungen – Begriffe, Verfahren, Auswertung, 2008.
Verfügbar unter: https://www.beuth.de/